如何把python绘制的动态图形保存为gif文件或视频
使用Matplotlib中的matplotlib.animation 方法可以绘制更好看、更有吸引力的动画图形,那如何把这种动画图形保存为Gif动画文件或视频文件呢?本文简述与之相关的方法。把Python/ target=_blank class=infotextkey>Python程序中绘制的动画图形保存为视频格式或gif格式文件,以便播放或发送给其他人,或者插入找文档或网页中。本文分两部分,先介绍python程序绘制简单的动态图形或动画(也可阅读 《python 绘制动画图》这篇文章),然后再介绍如何把绘制的动态图形或动画保存为gif格式文件或视频文件。
先用 Matplotlib.animation 类中的函数 FuncAnimation 创建动态图和动画,如动态折线、柱状图动画,另外还需要使用 figure 函数和 animation 函数,这些都是python使用matplotlib绘制图形时常用的方法。
1. 创建动态折线图
1)绘制动态折线图,代码如下:
import random
import matplotlib
import matplotlib.pyplot as plt
from matplotlib.animation import FuncAnimation

fig = plt.figure(figsize=(15,15))


x,y = [], []
index= count()
def animate(i):
    x.Append(next(index))
    y.append(random.randint(2,20))
    plt.style.use("ggplot")
    plt.plot(x,y)

ani = FuncAnimation(fig, animate, interval=300)
plt.show()
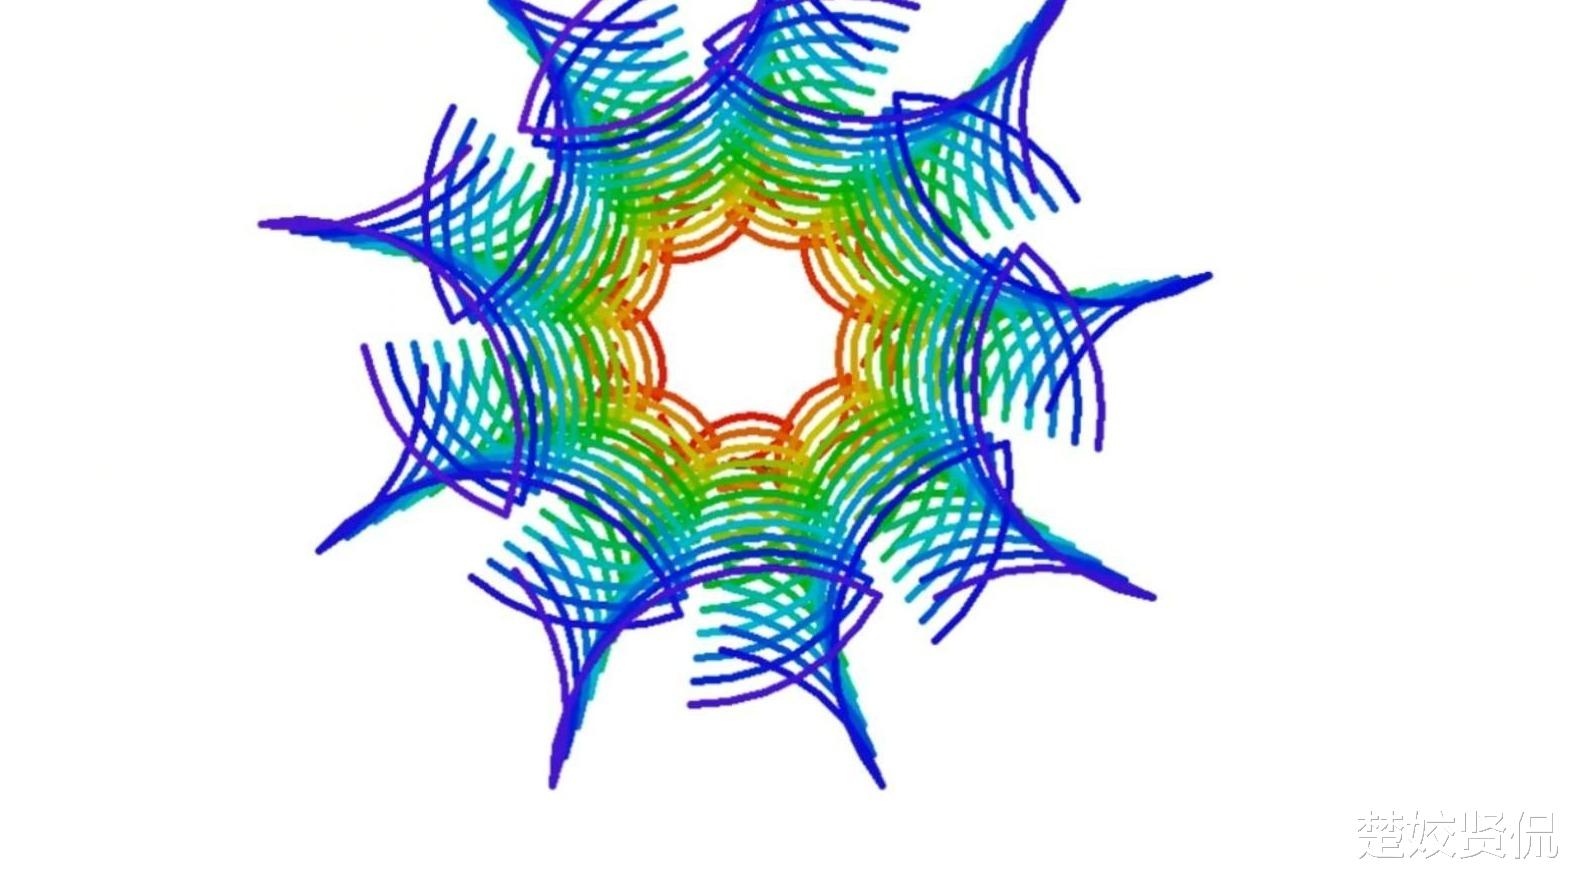
结果如图1:
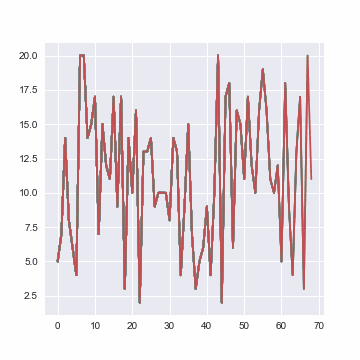
主要代码行说明:
以上代码块中 “ani = FuncAnimation(fig, animate, interval=300)” 这一行中,FuncAnimation() 有三个参数:
1) fig,表示图形参数
指容纳plot图形的对象, 需要创建该对象,或者调用 matplotlib.pyplot.gcf() 函数 ,表示获得当前图形;
2) animate 自定义函数
这是 FuncAnimation 中的动画自定义函数, 要想获得动画图形就要把该参数设定为“animate”,图形就会根据数据持续更新,注意创建图形和数据更新缺一不可。
3) 画面间隔参数 interval
该参数指定画面的更新速度,单位是毫秒。interval=1000 表示该函数运行动画函数,并且每秒钟更新一次。
以上代码块中 “plt.style.use("ggplot")” 这一行,指定动画图形的风格为 “ggplot”,要想了解更多的图形风格,可使用以下代码:
import matplotlib.pyplot as plt

print(plt.style.available)
输入结果如下:
bmh
classic
dark_background
fast
fivethirtyeight
ggplot
grayscale
seaborn-bright
seaborn-colorblind
seaborn-dark-palette
seaborn-dark
seaborn-darkgrid
seaborn-deep
seaborn-muted
seaborn-notebook
seaborn-paper
seaborn-pastel
seaborn-poster
seaborn-talk
seaborn-ticks
seaborn-white
seaborn-whitegrid
seaborn
Solarize_Light2
tableau-colorblind10
_classic_test
上述代码块输出的图形结果中,两个数轴都是不固定的,这与 Matplotlib Axes Setting 有关,plot函数中也没有定义线的颜色。
2.创建动画图形
代码如下:
import matplotlib.pyplot as plt
from matplotlib.animation import FuncAnimation
%matplotlib qt

fig = plt.figure(figsize=(6,4))
axes = fig.add_subplot(1,1,1)
plt.title("Dynamic Axes")

y1 = [random.randint(-10,10)+(i**1.6)/(random.randint(9,12)) for i in range(0,280,2)]
t = range(len(y1))
x,y=[], []

def animate(i):
    x.append(t[i])
    y.append((y1[i]))
    plt.xlim(i-30,i+3)
    axes.set_ylim(y1[i]-100, y1[i]+100)
    plt.plot(x,y, scaley=True, scalex=True, color="red")

anim = FuncAnimation(fig, animate, interval=100)
输出结果如图2:
图2 动态数轴动画
保存动态图形
保存Matplotlib绘制的动画可能会出现一些小故障。下面介绍一下常用的选项和参数,既可以节省保存动画所需的时间,又可以尽可能地减少故障;可以把python代码生成的动画保存为个人需要的格式,如gif、mp4、avi、mov等文件格式,这取决于保存时选择对应的参数。
- 保存为GIF文件--图1,代码如下:
f = r"d:\animation.gif"
writergif = animation.PillowWriter(fps=30)
anim.save(f, writer=writergif)
这段代码中,常用的选项有 ImageMagick 和 PillowWriter。
对于windows 操作系统来说,使用 ImageMagick 方法一般要先安装相关程序包,并且在保存动画为 GIF 文件时,建议使用 Write Instance,还是比较复杂;如果是Unix操作系统,ImageMagick一般情况下都已经安装了,使用 ImageMagick 方法 就方便。因此,建议windows用户使用 PillowWriter 方法。
定义 gif 图形的帧数:
修改 FuncAnimation函数中的 save_count 参数的值,设定 GIF 文件的帧数,默认为 100 帧,代码如下:
anim = animation.FuncAnimation(figure, func=update_figure, fargs=(bar_rects, iteration), frames=generator, interval=100, repeat=True, save_count=1500)
示例代码中,把GIF文件的帧数修改为 1500 帧。
- 保存为视频文件
把调用matplotlib的方法生成的动画保存为视频文件,需要 ffmpeg.exe 安装程序,可到官网下载,如下图:
特别注意,安装后要把该运行程序的路径 ffmpegbinffmpeg.exe 添加到环境变量中,此路径一定要正确 并且一定是指向可执行文件,而不仅仅是该文件所在的文件夹。在生成动画的python程序块中要加入以下代码行:
import matplotlib as mpl
mpl.rcParams['animation.ffmpeg_path'] = r'C:\Users\xx\Desktop\ffmpeg\bin\ffmpeg.exe'
接下来,把 matplotlib 绘制的动画保存为 mp4 格式的视频文件,代码如下:
f = r"d:\animation.mp4"
writervideo = animation.FFMpegWriter(fps=60)
anim.save(f, writer=writervideo)
定义视频的尺寸:
视频的尺寸就是用 matplotlib 工具包绘制图形的窗口大小,调整对应窗口的大小即刻,示例代码如下:
plt.subplots(figsize=(12,8))
(本文结束)


