PMM(Percona Monitoring and Management)是一个免费的开源平台,用于管理和监视数据库性能,在Docker环境中即可运行。它可以主动管理和监控MySQL(AWS RDS MySQL、Aurora MySQL、用户自建MySQL实例)、MariaDB、MongoDB、PostgreSQL等数据库,也可以监控ProxySQL中间件,并提供了众多指标与多样告警方式。
Percona Monitoring and Management (PMM)是一款开源的用于管理和监控MySQL和MongoDB性能的开源平台,通过PMM客户端收集到的DB监控数据用第三方软件Grafana画图展示出来。
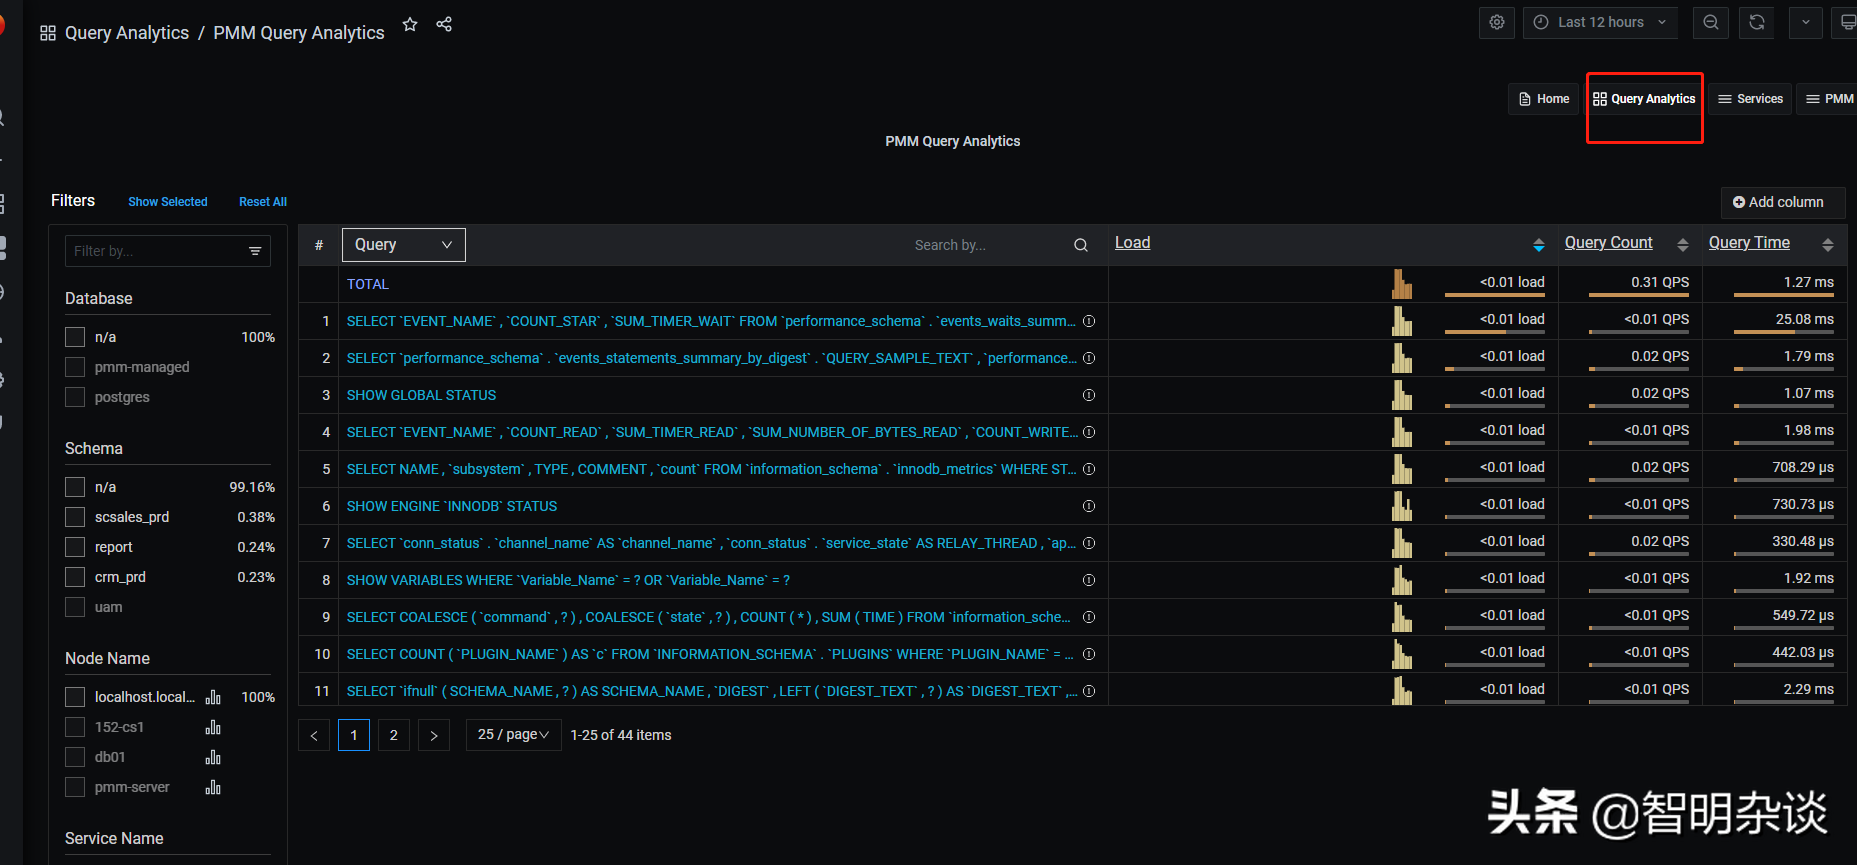
PMM提供了对MyISAM、InnoDB、TokuDB和PXC/Glarera的监控,另外也提供了Query Analytics的功能,可以检视执行了哪些SQL指令,并对执行效能较差的语法进行优化。另外在新版本还支持了MySQL复制拓扑图结构构造。Demo官网:
http://pmmdemo.percona.com
PMM针对操作系统的部份也提供了硬盘、网络、CPU和RAM的监控,特别的是它提供了Context switches、Processes和interrupts的监控,Context Switches可以看到CPU上下切换文的状况,Processes可以方便了解系统有多少程序在等待I/O。
PMM整体来说算是一款不错的监控产品,针对MySQL、PG、Mongo都有很专业的指标统计,而且部署简单整套打包到容器中。2.0之后底层持久化数据库从MySQL更换为PG后,性能更是有很大提升。
整体架构图
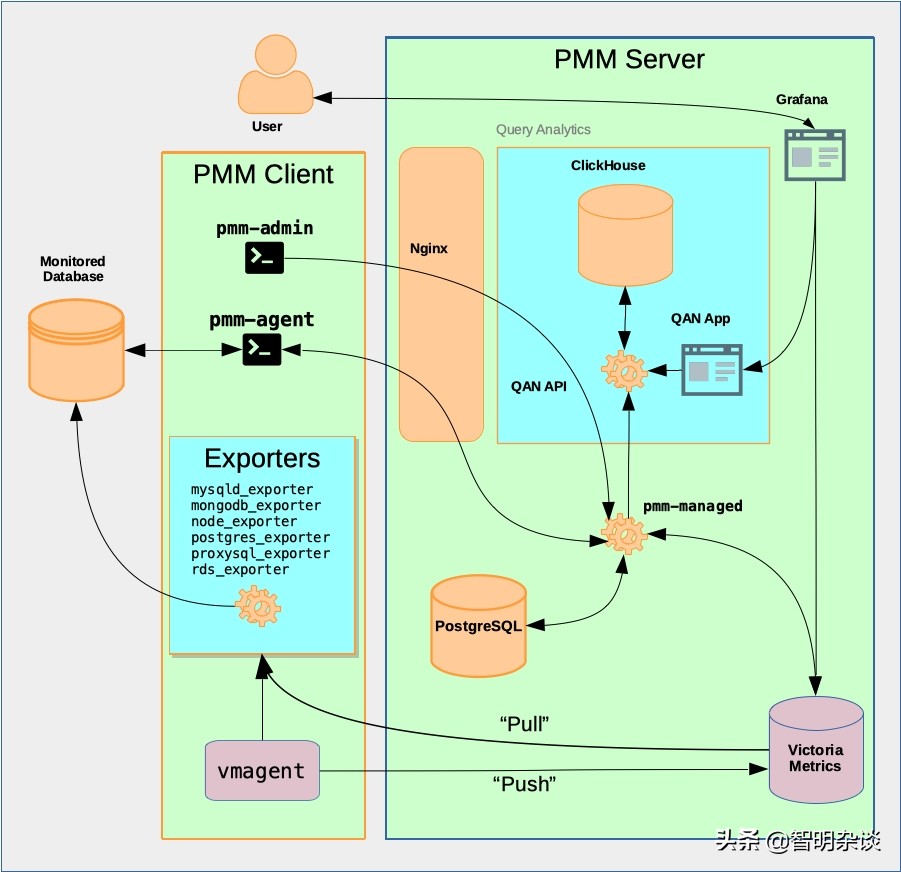
server端组件介绍
- uery Analytics (QAN) enables you to analyze MySQL query performance over periods of time. In addition to the client-side QAN agent, it includes the following:QAN API is the back-end for storing and accessing query data collected by the QAN agent running on a PMM Client.QAN Web App is a web application for visualizing collected Query Analytics data.
- Metrics Monitor provides a historical view of metrics that are critical to a MySQL or MongoDB server instance. It includes the following:
- VictoriaMetrics, a scalable time-series database. (Replaced Prometheus in PMM 2.12.0.)
- ClickHouse is a third-party column-oriented database that facilitates the Query Analytics functionality.
- Grafana is a third-party dashboard and graph builder for visualizing data aggregated (by VictoriaMetrics or Prometheus) in an intuitive web interface.
- Percona Dashboards is a set of dashboards for Grafana developed by us.
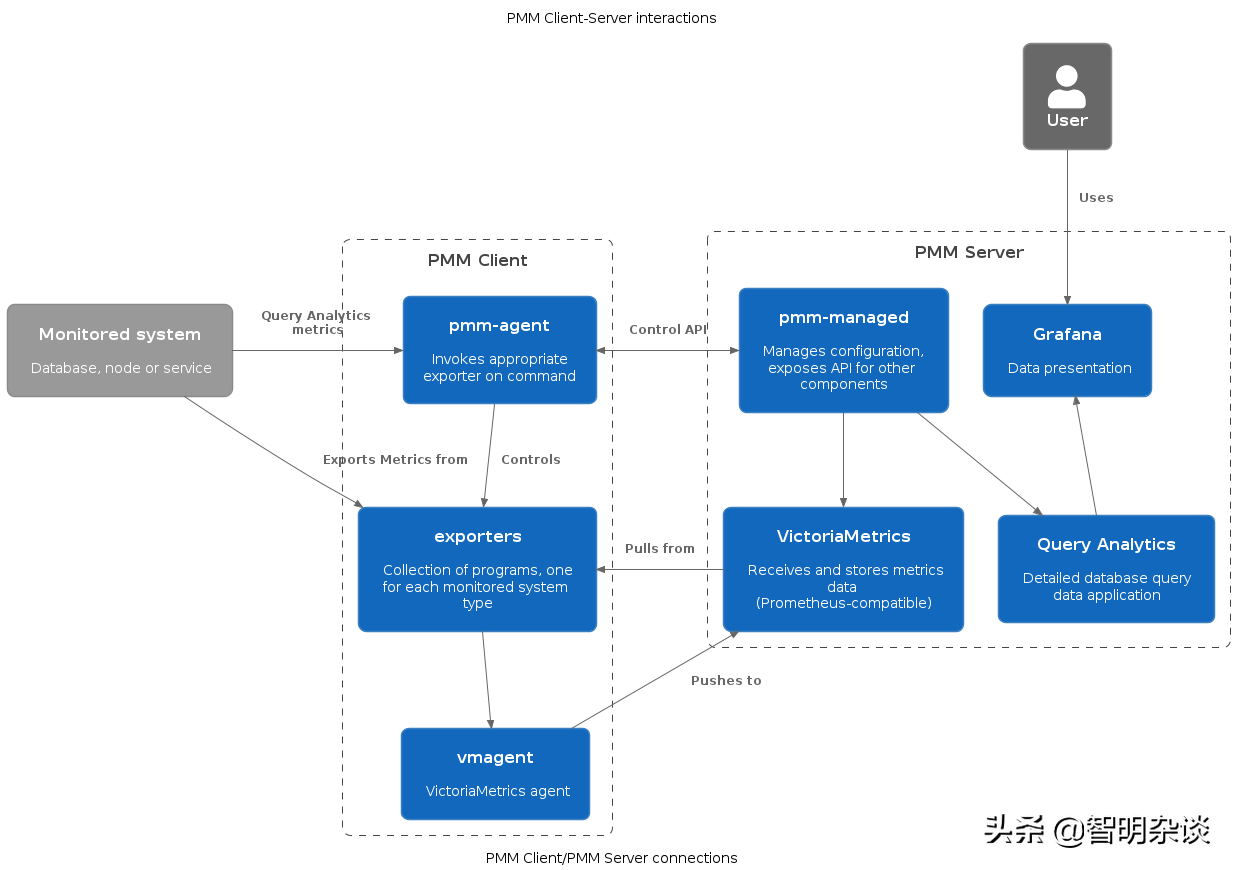
Agent端架构
PMM客户端和服务端整体结构
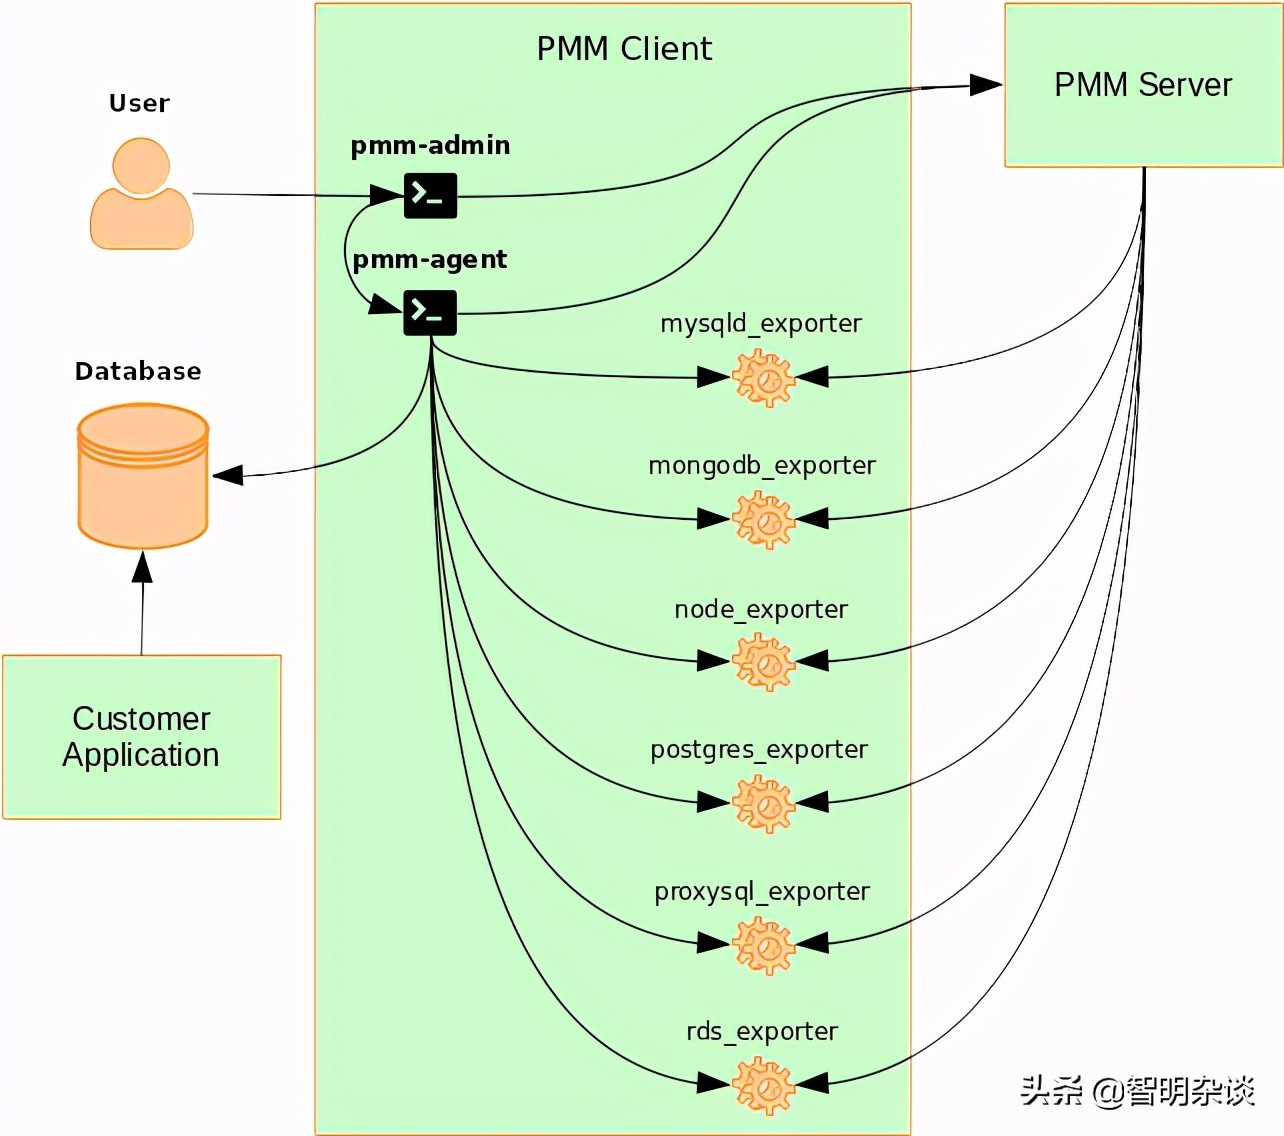
agent端组件介绍
The PMM Client package consist of the following:
- pmm-admin is a command-line tool for managing PMM Client, for example, adding and removing database instances that you want to monitor. (Read more).
- pmm-agent is a client-side component a minimal command-line interface, which is a central entry point in charge for bringing the client functionality: it carries on client’s authentication, gets the client configuration stored on the PMM Server, manages exporters and other agents.
- node_exporter is an exporter that collects general system metrics.
- mysqld_exporter is an exporter that collects MySQL server metrics.
- mongodb_exporter is an exporter that collects MongoDB server metrics.
- postgres_exporter is an exporter that collects PostgreSQL performance metrics.
- proxysql_exporter is an exporter that collects ProxySQL performance metrics.
- rds_exporter is an exporter that collects Amazon RDS performance metrics.
- azure_database_exporter is an exporter that collects Azure database performance metrics.
安装使用
官网:
https://www.percona.com/software/pmm/quickstart#awsrds
安装server端:10.10.119.65
1 docker create -v /srv --name pmm-data percona/pmm-server:2 /bin/true
2 docker run -d -p 280:80 -p 1443:443 --volumes-from pmm-data --name pmm-server --restart always percona/pmm-server:2

添加agent:10.10.119.64
yum install https://repo.percona.com/yum/percona-release-latest.noarch.rpm
yum install pmm2-client

配置agent
[root@localhost ~]# pmm-admin config --server-insecure-tls --server-url=https://admin:admin@10.10.119.65:1443
Checking local pmm-agent status...
pmm-agent is running.
Registering pmm-agent on PMM Server...
Registered.
Configuration file /usr/local/percona/pmm2/config/pmm-agent.yaml updated.
Reloading pmm-agent configuration...
Configuration reloaded.
Checking local pmm-agent status...
pmm-agent is running.
添加MySQL监控
[root@localhost ~]# pmm-admin add mysql --username=lzm --password=123 --query-source=perfschema --service-name=my64
MySQL Service added.
Service ID  : /service_id/ed926231-5110-4e0b-a463-83cf4957374f
Service name: my64

Table statistics collection disabled (the limit is 1000, the actual table count is 3688).
这里显示这个工具最多只能收集1000个表的统计信息.我现在库里超过了1000个表
查看客户端组件状态
[root@localhost ~]# pmm-admin list
Service type        Service name        Address and port        Service ID
MySQL               my64                127.0.0.1:3306          /service_id/ed926231-5110-4e0b-a463-83cf4957374f

Agent type                    Status           Metrics Mode        Agent ID                                              Service ID
pmm_agent                     Connected                            /agent_id/c5769237-fb8e-4577-8f96-5d15ba2f87a4
node_exporter                 Running          push                /agent_id/56a8349d-cf2d-45db-9bdb-d4aaa700604c
mysqld_exporter               Running          push                /agent_id/943c161b-4a6f-4d56-97fd-83a19b683d95        /service_id/ed926231-5110-4e0b-a463-83cf4957374f
mysql_perfschema_agent        Running                              /agent_id/69a24be4-4f04-4137-a7e3-d33e72d62390        /service_id/ed926231-5110-4e0b-a463-83cf4957374f
vmagent                       Running          push                /agent_id/b851adf7-4dc8-4da6-ace6-2d4e6e644b00
移除某个agent监控
[root@db01 ~]# pmm-admin remove mysql mysql-64
Service removed.
查看agent运行状态
root@152-cs1 ~]# pmm-admin status
Agent ID: /agent_id/05c1e77a-1c7d-42c6-bdb8-1da50cc78bdb
Node ID : /node_id/f89d1cd3-c56c-4c46-a7fa-6d0b703bb3e5

PMM Server:
	URL    : https://10.10.119.65:1443/
	Version: 2.20.0

PMM Client:
	Connected        : true
	Time drift       : -200.069349ms
	Latency          : 1.774292ms
	pmm-admin version: 2.20.0
	pmm-agent version: 2.20.0
Agents:
	/agent_id/bf327533-c543-45c8-b21c-9b3310e62066 mysqld_exporter Running
	/agent_id/e14863b3-dcb1-4f9b-afb8-8ece1ea372d7 mysql_perfschema_agent Running
	/agent_id/f6c1b851-dc40-486f-b3cf-be8b4dafd64c node_exporter Running
	/agent_id/f8608530-2312-4bbd-9ffc-1f55bb9777a6 vmagent Running
查看各种pmm-admin命令 :
https://www.percona.com/doc/percona-monitoring-and-management/2.x/details/commands/pmm-admin.html
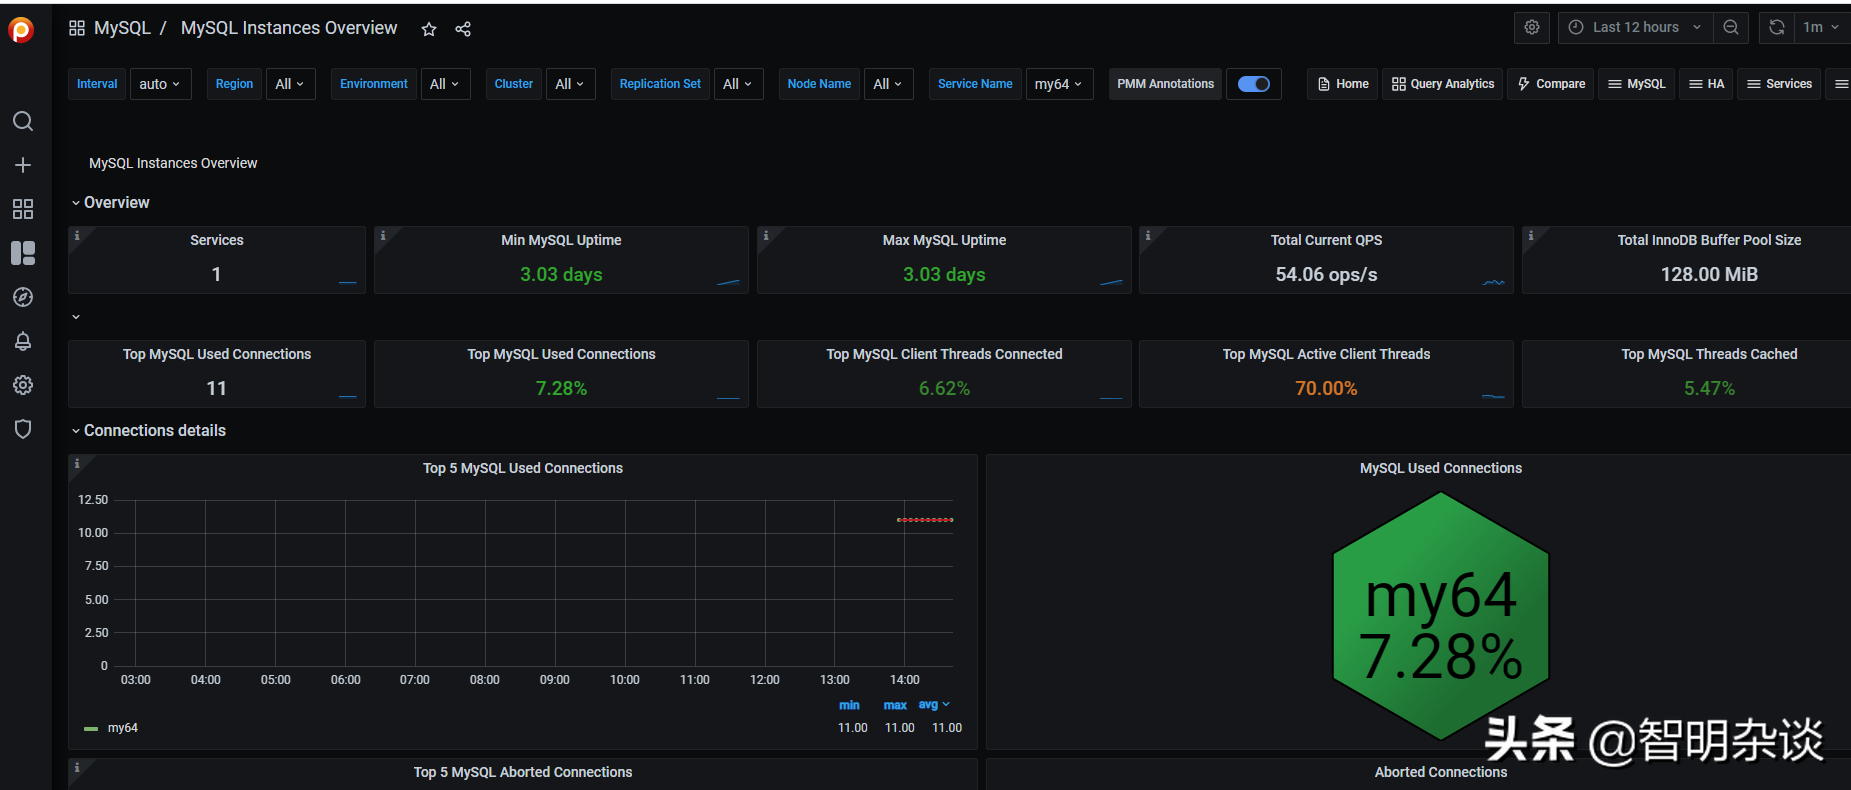
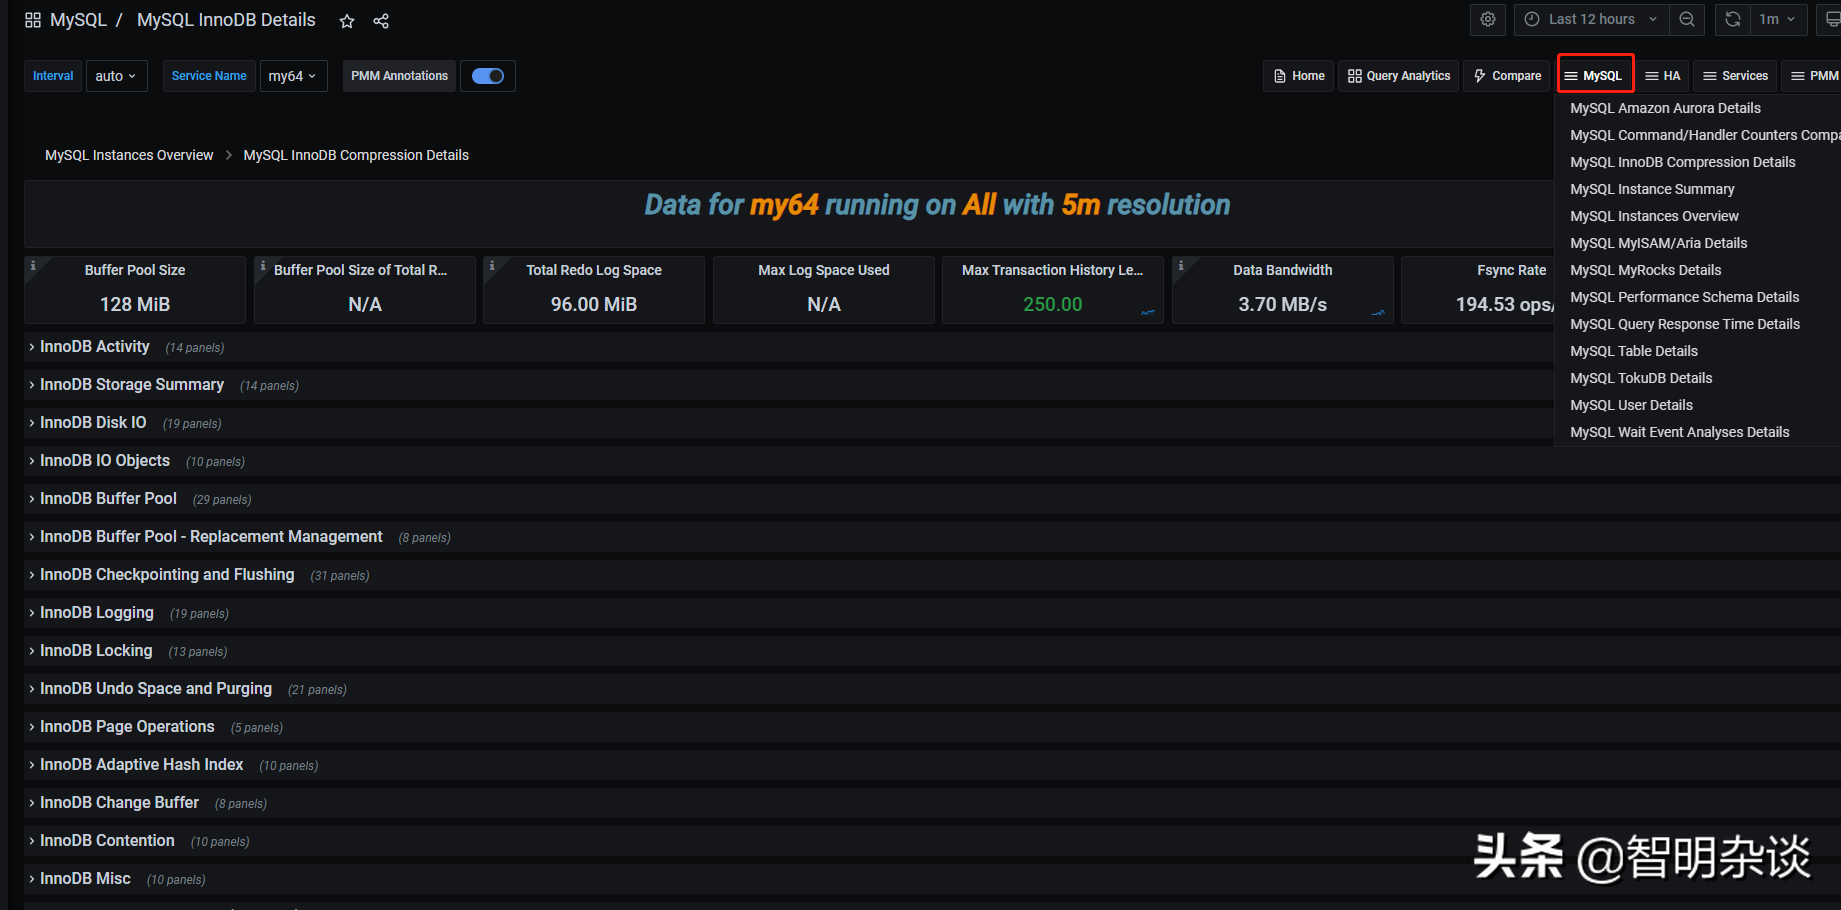
web页面查看