记一次Rust内存泄漏排查之旅
在某次持续压测过程中,我们发现 GreptimeDB 的 Frontend 节点内存即使在请求量平稳的阶段也在持续上涨,直至被 OOM kill。我们判断 Frontend 应该是有内存泄漏了,于是开启了排查内存泄漏之旅。
Heap Profiling
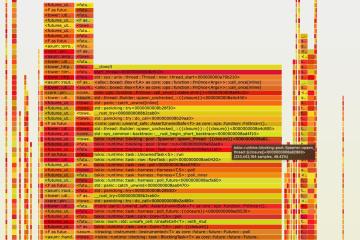
大型项目几乎不可能只通过看代码就能找到内存泄漏的地方。所以我们首先要对程序的内存用量做统计分析。幸运的是,GreptimeDB 使用的 jemalloc 自带 heap profiling[1],我们也支持了导出 jemalloc 的 profile dump 文件[2]。于是我们在 GreptimeDB 的 Frontend 节点内存达到 300MB 和 800MB 时,分别 dump 出了其内存 profile 文件,再用 jemalloc 自带的 jeprof 分析两者内存差异(--base 参数),最后用火焰图显示出来:
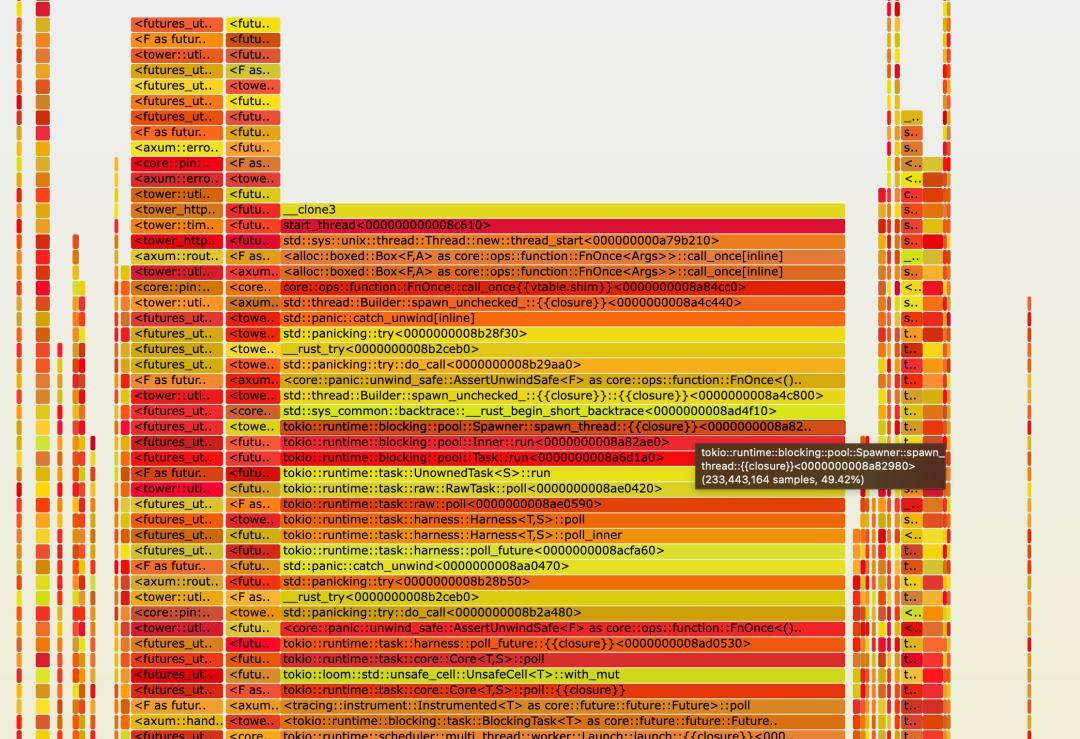
显然图片中间那一大长块就是不断增长的 500MB 内存占用了。仔细观察,居然有 thread 相关的 stack trace。难道是创建了太多线程?简单用 ps -T -p 命令看了几次 Frontend 节点的进程,线程数稳定在 84 个,而且都是预知的会创建的线程。所以“线程太多”这个原因可以排除。
再继续往下看,我们发现了很多 Tokio runtime 相关的 stack trace,而 Tokio 的 task 泄漏也是常见的一种内存泄漏。这个时候我们就要祭出另一个神器:Tokio-console[3]。
Tokio Console
Tokio Console 是 Tokio 官方的诊断工具,输出结果如下:
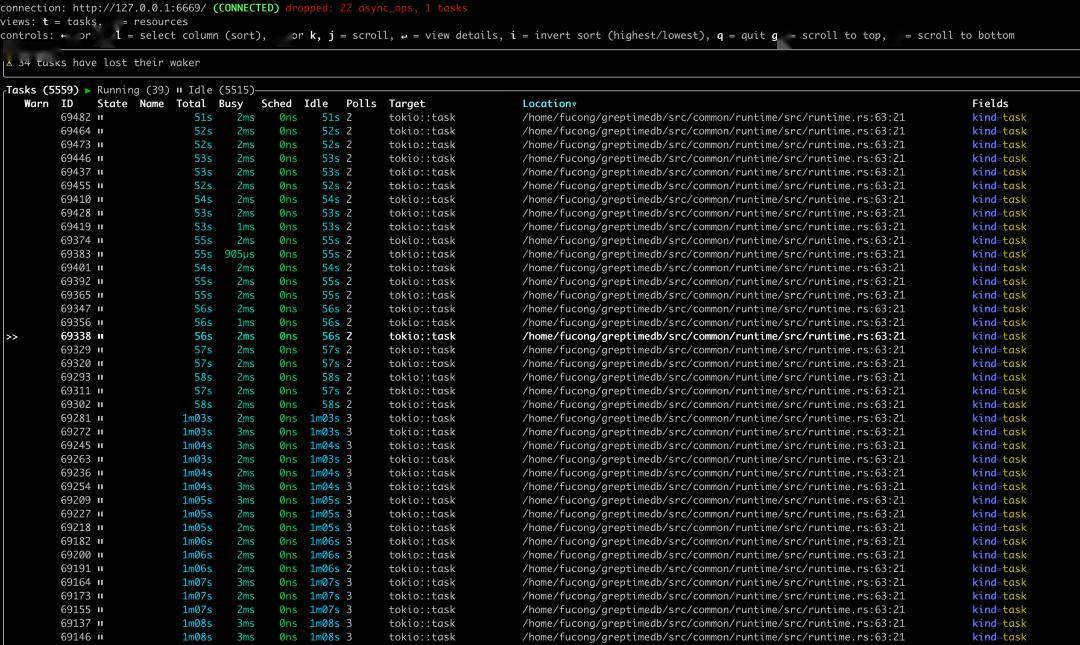
我们看到居然有 5559 个正在运行的 task,且绝大多数都是 Idle 状态!于是我们可以确定,内存泄漏发生在 Tokio 的 task 上。现在问题就变成了:GreptimeDB 的代码里,哪里 spawn 了那么多的无法结束的 Tokio task?
从上图的 "Location" 列我们可以看到 task 被 spawn 的地方[4]:
implRuntime{
/// Spawn a future and execute it in this thread pool
///
/// Similar to Tokio::runtime::Runtime::spawn
pubfnspawn<F>(&self, future: F) -> JoinHandle<F::Output>
where
F: Future + Send+ 'static,
F::Output: Send+ 'static,
{
self.handle.spawn(future)
}
}
接下来的任务是找到 GreptimeDB 里所有调用这个方法的代码。
..Default::default
经过一番看代码的仔细排查,我们终于定位到了 Tokio task 泄漏的地方,并在 PR #1512[5]中修复了这个泄漏。简单地说,就是我们在某个会被经常创建的 struct 的构造方法中,spawn 了一个可以在后台持续运行的 Tokio task,却未能及时回收它。对于资源管理来说,在构造方法中创建 task 本身并不是问题,只要在 Drop 中能够顺利终止这个 task 即可。而我们的内存泄漏就坏在忽视了这个约定。
这个构造方法同时在该 struct 的 Default::default 方法当中被调用了,更增加了我们找到根因的难度。
Rust 有一个很方便的,可以用另一个 struct 来构造自己 struct 的方法,即 "Struct Update Syntax"[6]。如果 struct 实现了 Default,我们可以简单地在 struct 的 field 构造中使用 ..Default::default。
如果 Default::default内部有 “side effect”(比如我们本次内存泄漏的原因——创建了一个后台运行的 Tokio task),一定要特别注意:struct 构造完成后,Default创建出来的临时 struct 就被丢弃了,一定要做好资源回收。
例如下面这个小例子:Rust Playground[7]
structA{
i: i32,
}
implDefaultforA{
fndefault-> Self{
println!("called A::default");
A { i: 42}
}
}
#[derive(Default)]
structB{
a: A,
i: i32,
}
implB{
fnnew(a: A) -> Self{
B {
a,
// A::default is called in B::default, even though "a" is provided here.
..Default::default
}
}
}
fnmAIn{
leta= A { i: 1};
letb= B::new(a);
println!("{}", b.a.i);
}
struct A 的 default 方法是会被调用的,打印出 called A::default。
总结
• 排查 Rust 程序的内存泄漏,我们可以用 jemalloc 的 heap profiling 导出 dump 文件;再生成火焰图可直观展现内存使用情况。
• Tokio-console 可以方便地显示出 Tokio runtime 的 task 运行情况;要特别注意不断增长的 idle tasks。
• 尽量不要在常用 struct 的构造方法中留下有副作用的代码。
•Default只应该用于值类型 struct。
参考
[1] https://Github.com/jemalloc/jemalloc/wiki/Use-Case%3A-Heap-Profiling
[2] https://github.com/GreptimeTeam/greptimedb/blob/develop/src/common/mem-prof/README.md
[3] https://github.com/tokio-rs/console
[4] https://github.com/GreptimeTeam/greptimedb/blob/develop/src/common/runtime/src/runtime.rs#L63
[5] https://github.com/GreptimeTeam/greptimedb/pull/1512
[6] https://doc.rust-lang.org/book/ch05-01-defining-structs.html#creating-instances-from-other-instances-with-struct-update-syntax
[7] https://play.rust-lang.org/?version=stable&mode=debug&edition=2021&gist=c121ffd32d2ff0fa8e1241a62809bcef